Now that we have learned to make scatter plots using MatPlotLib, let's learn to plot a curve. I'm assuming you've already imported Matplotlib.pyplot. To plot a curve, you need to use the function,
plt.plot(x, f(x))
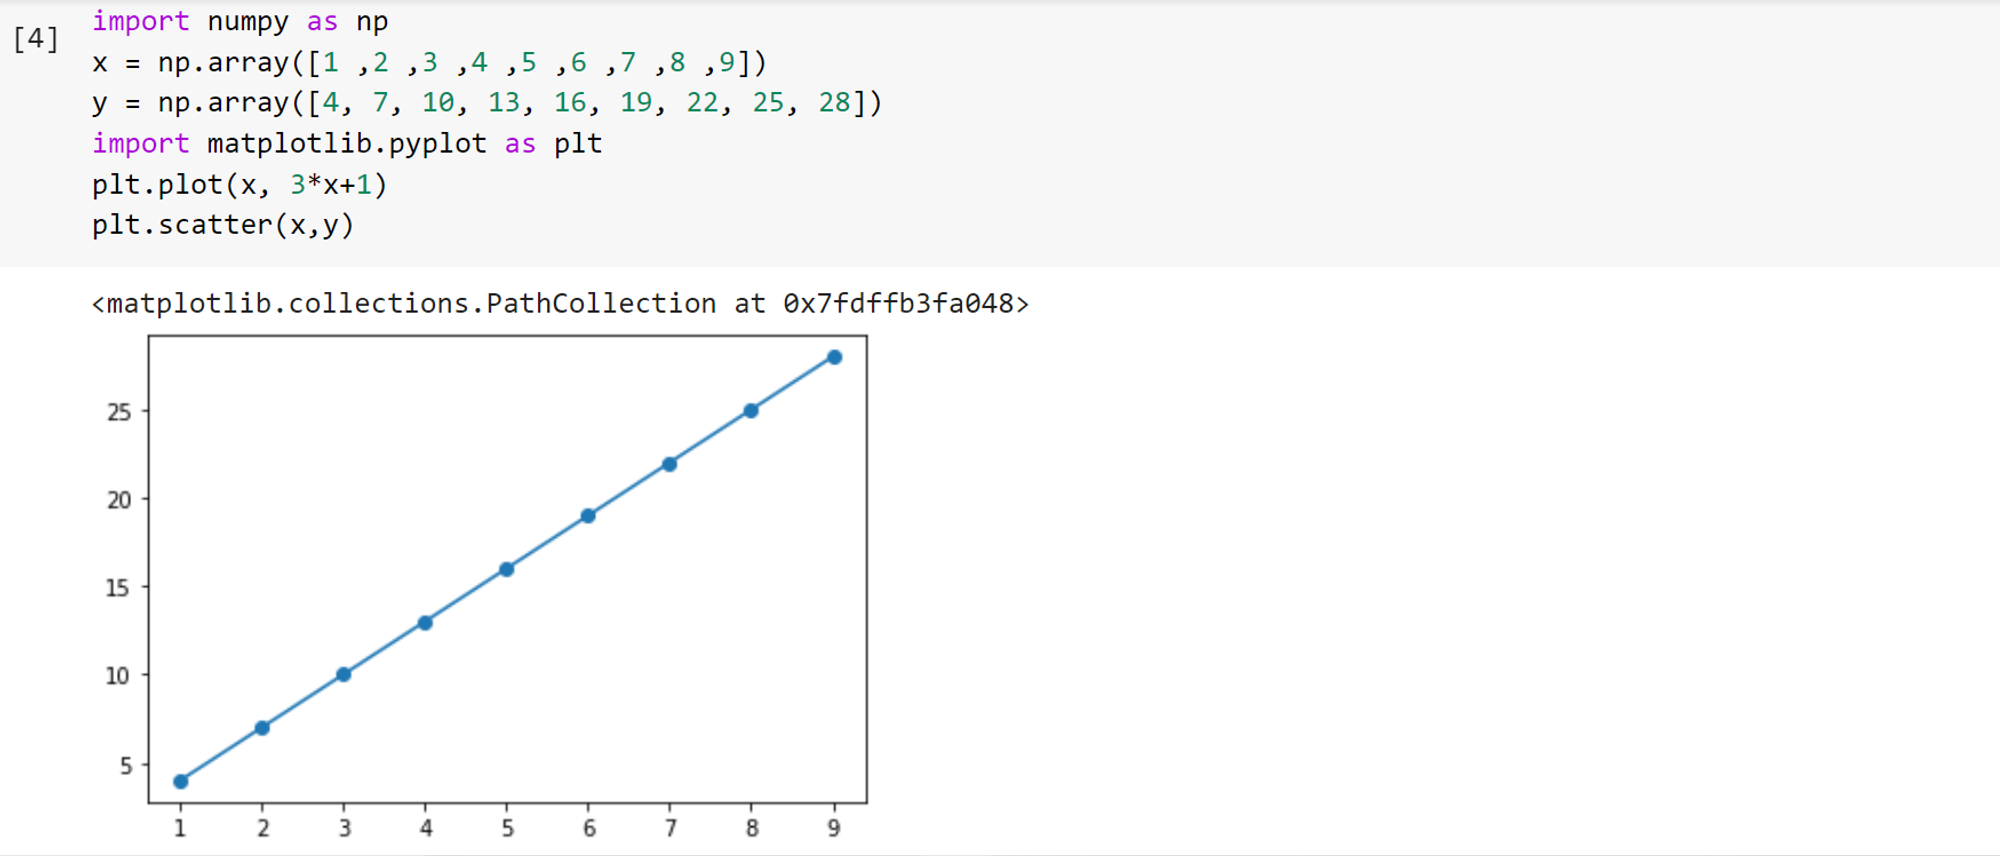
For example:
import numpy as np
x = np.array([1 ,2 ,3 ,4 ,5 ,6 ,7 ,8 ,9])
y = np.array([4, 7, 10, 13, 16, 22, 25, 28])
import matplotlib.pyplot as plt
plt.plot(x, 3*x+1)
ply.scatter(x,y)
Practice plotting some of these curves, and see whether they look like they do when you manually plot them:
9x + 1
8x + (7/x) + 1
sin (x)
For the last one, the in-built function can perform the sine operation on a NumPy array.
np.sin()
Also don't worry about the scatter command in the example code, that was just to show you how the curve passes through the corresponding points.
Copyright © 2021 Code 4 Tomorrow. All rights reserved.
The code in this course is licensed under the MIT License.
If you would like to use content from any of our courses, you must obtain our explicit written permission and provide credit. Please contact classes@code4tomorrow.org for inquiries.