Let’s say you suddenly realized you had a test today, and you haven’t studied. Not a good place to be in. But you know the test is an MCQ - it consists of questions that provide the student with multiple choices, from which they have to choose the right answer. If the teacher were not careful about placing the correct answer as different choices in different questions (A being the right answer for 1, C being the right answer for 2, and so on), a student who simply picked A every time could very well be the highest-performing in their class. Tests are intended to reflect the student’s knowledge, so naturally this would be undesirable for the teacher.
In some cases, the likelihood of a particular class occurring will be much more than its counterpart/s. In such a situation, it is possible that a “blind” algorithm could simply classify every single example fed to it as part of the more likely class, and receive a very good error metric score. Naturally, we don’t want this. This could mean false diagnosis in a medical AI or lost productivity in a factory, so we have serious motivations to make sure our model is not doing this.
This is where Precision and Recall come in. But first, let’s look at what’s called a confusion matrix. Don’t worry, it’s actually pretty simple.
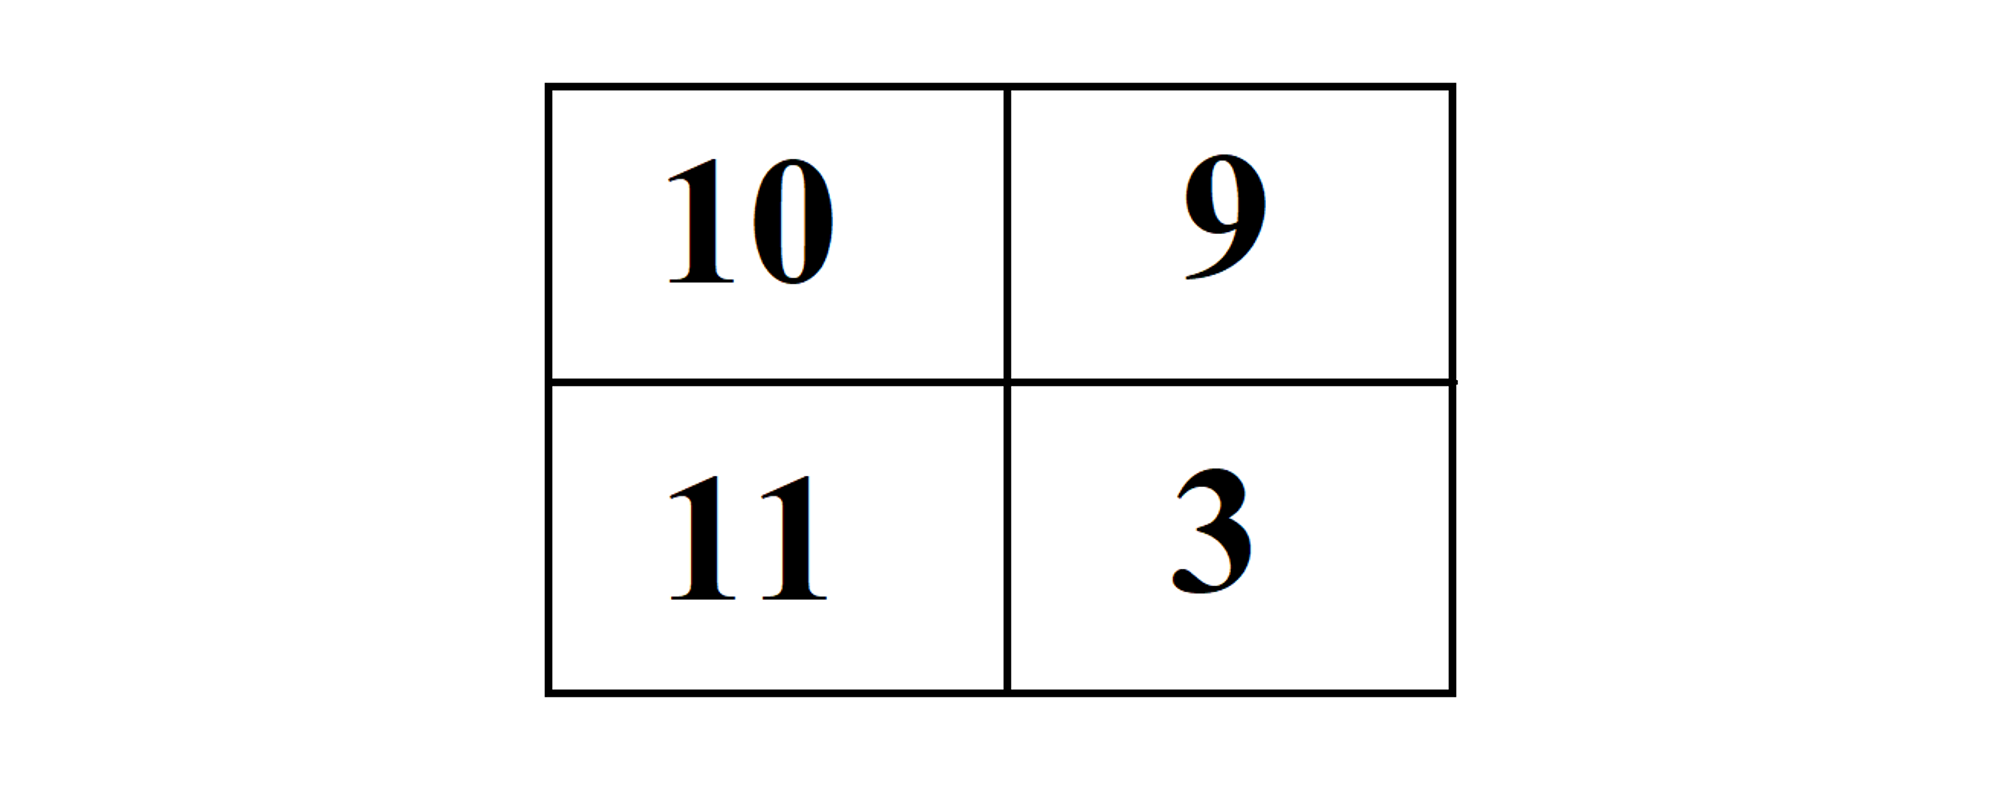
As you can see, there are two columns and two rows. Let’s say we are diagnosing the malfunction of certain machines in a factory, based on old data. The first column represents when there is really a problem, while the second column indicates the operational machines. The first row indicates that we are predicting that the Machine has malfunctioned, and the second indicates that we are predicting it is working well. The four blocks then attain these names:
1. The intersection of the first column and first row is the number of true positives. In this example, this is the number of machines who were predicted to be malfunctioning, and were actually doing so.
2. The intersection of the first column and the second row is the number of false negatives. As the name suggests, this would represent the number of machines who were predicted to be working well, when in reality they are malfunctioning.
3. The intersection of the second column and the first row is the number of false positives. This indicates machines that are predicted to be malfunctioning, but are not so.
4. The intersection of the second column and the second row is the number of true negatives. These are machines which are operational and were diagnosed as such.
Now we can use these to compute precision and recall.
Precision is the number of true positives divided by the total number of predicted positives:
Recall is the number of true positives divided by the total number of true positives:
Precision emphasizes how accurate or true the predictions are, while Recall emphasizes how many of the true cases the model was able to detect. The latter will help us avoid a model which constantly generates negatives - that is, that all machines are doing good -, because that detects none of the malfunctions. Naturally, the greater the Precision and Recall, the better, but if one is very good while the other is very poor, this is usually a warning sign. To make this all a little easier, we have a quantity called the F1-Score which combines the Precision and Recall. We will not go into the mathematical details of this, but you will see how to implement it in sklearn.
Congratulations! You have just learned some of the most important classification error metrics, and you will soon be able to evaluate how accurate and useful your models are in Python.
Previous Section
4.3 Log LossNext Section
4.5: ImplementationCopyright © 2021 Code 4 Tomorrow. All rights reserved.
The code in this course is licensed under the MIT License.
If you would like to use content from any of our courses, you must obtain our explicit written permission and provide credit. Please contact classes@code4tomorrow.org for inquiries.