Intuition
The Jaccard Index stems from the idea of sets. Consider two sets, and , represented in a Venn Diagram:
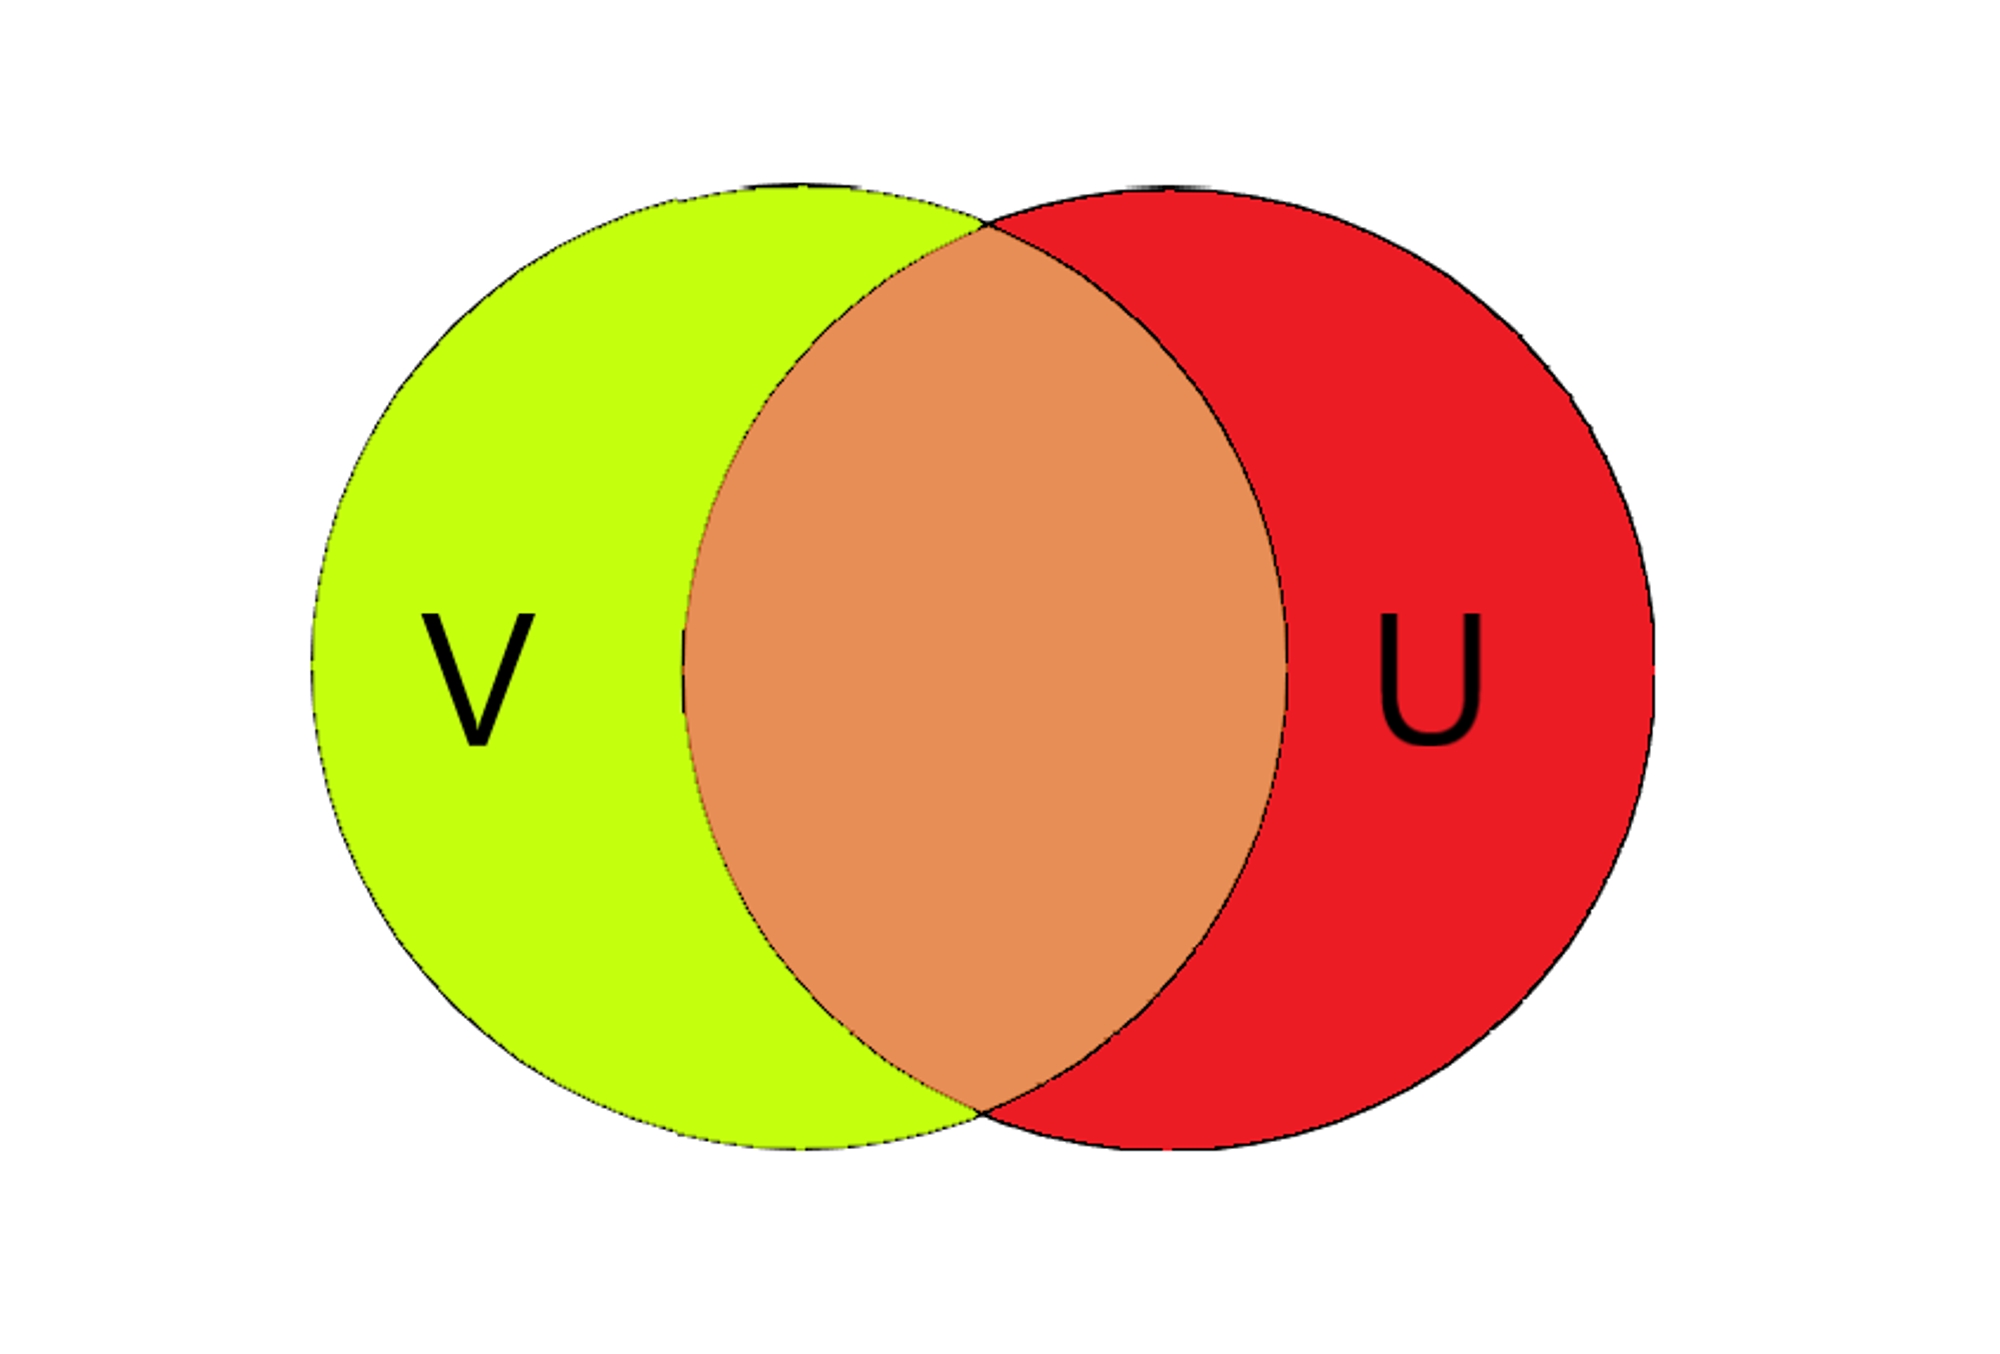
The sets and each contain a certain number of elements, the items in each collection. The brownish section in the middle indicates the intersection between and . This means that the intersection contains all items that are common between and . On the other hand, the red and yellow sections all contain exclusive elements that are not present in the other set. The
Jaccard Similarity Index, which we will be using, is a measure of the ratio between the number of intersecting elements and the total number of elements.
Formally, the Jaccard Similarity Index is:
Well, how does this apply to Machine Learning?
The role of evaluation metrics is that they compare the predictions and the actual output data. The closer these two are, the better the model. This is what the Jaccard Similarity Index does as well. If we consider A to be the set of predictions, and set B to the set of output data, applying the Jaccard Similarity Index Formula will give us how similar the two sets are.
That was just some background, don’t worry about understanding all the mathematics. This will be implemented using a Python Library, so you will not be required to understand the logical basis. The closer the Jaccard Similarity Index is to 1, the more accurate the model.
References:
1. https://deepai.org/machine-learning-glossary-and-terms/jaccard-index
Previous Section
4.1 IntroductionNext Section
4.3 Log LossCopyright © 2021 Code 4 Tomorrow. All rights reserved.
The code in this course is licensed under the MIT License.
If you would like to use content from any of our courses, you must obtain our explicit written permission and provide credit. Please contact classes@code4tomorrow.org for inquiries.