We aren't limited to just linear and polynomial regression models to fit curves to the data. Let's try utilizing some other functions that we've learned about in math:
Logarithmic
The logarithm is a fundamental mathematical function, written as . That said, if you haven't learnt to use it yet - no issues. Here's what it looks like:
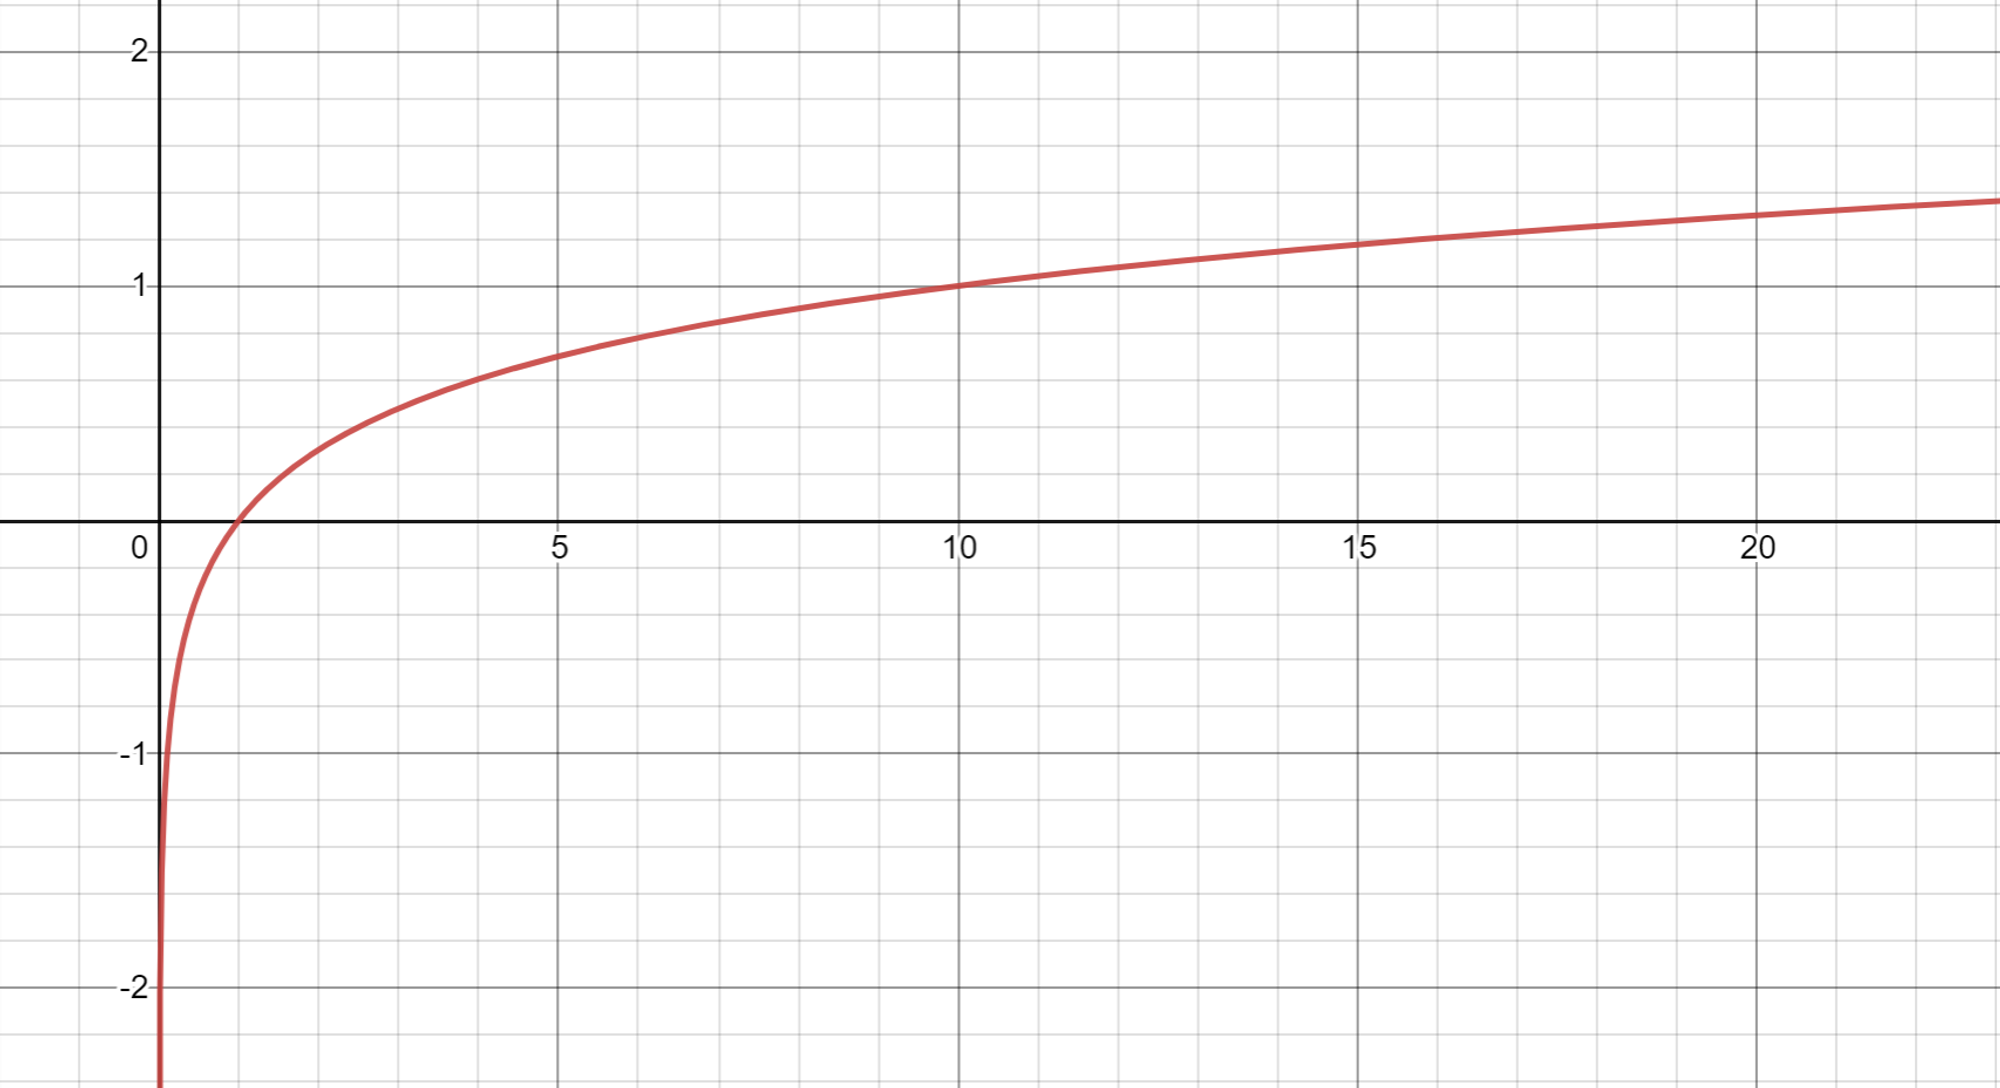
The logarithmic function doesn't take negative or zero inputs, which is why the graph of the function never crosses the y-axis. In any case, if you see this shape, or something similar (scaled up/down or slightly stretched) in the data, a logarithmic model may be a good idea. If you think you can see the function inverted, that may also be fitted best by a logarithmic model, albeit after you have transformed the data in some way. This maybe a little too complicated, however, and normally shouldn't be required. To produce the result of applying log to some input x in Python, use the function
np.log(x).Exponential
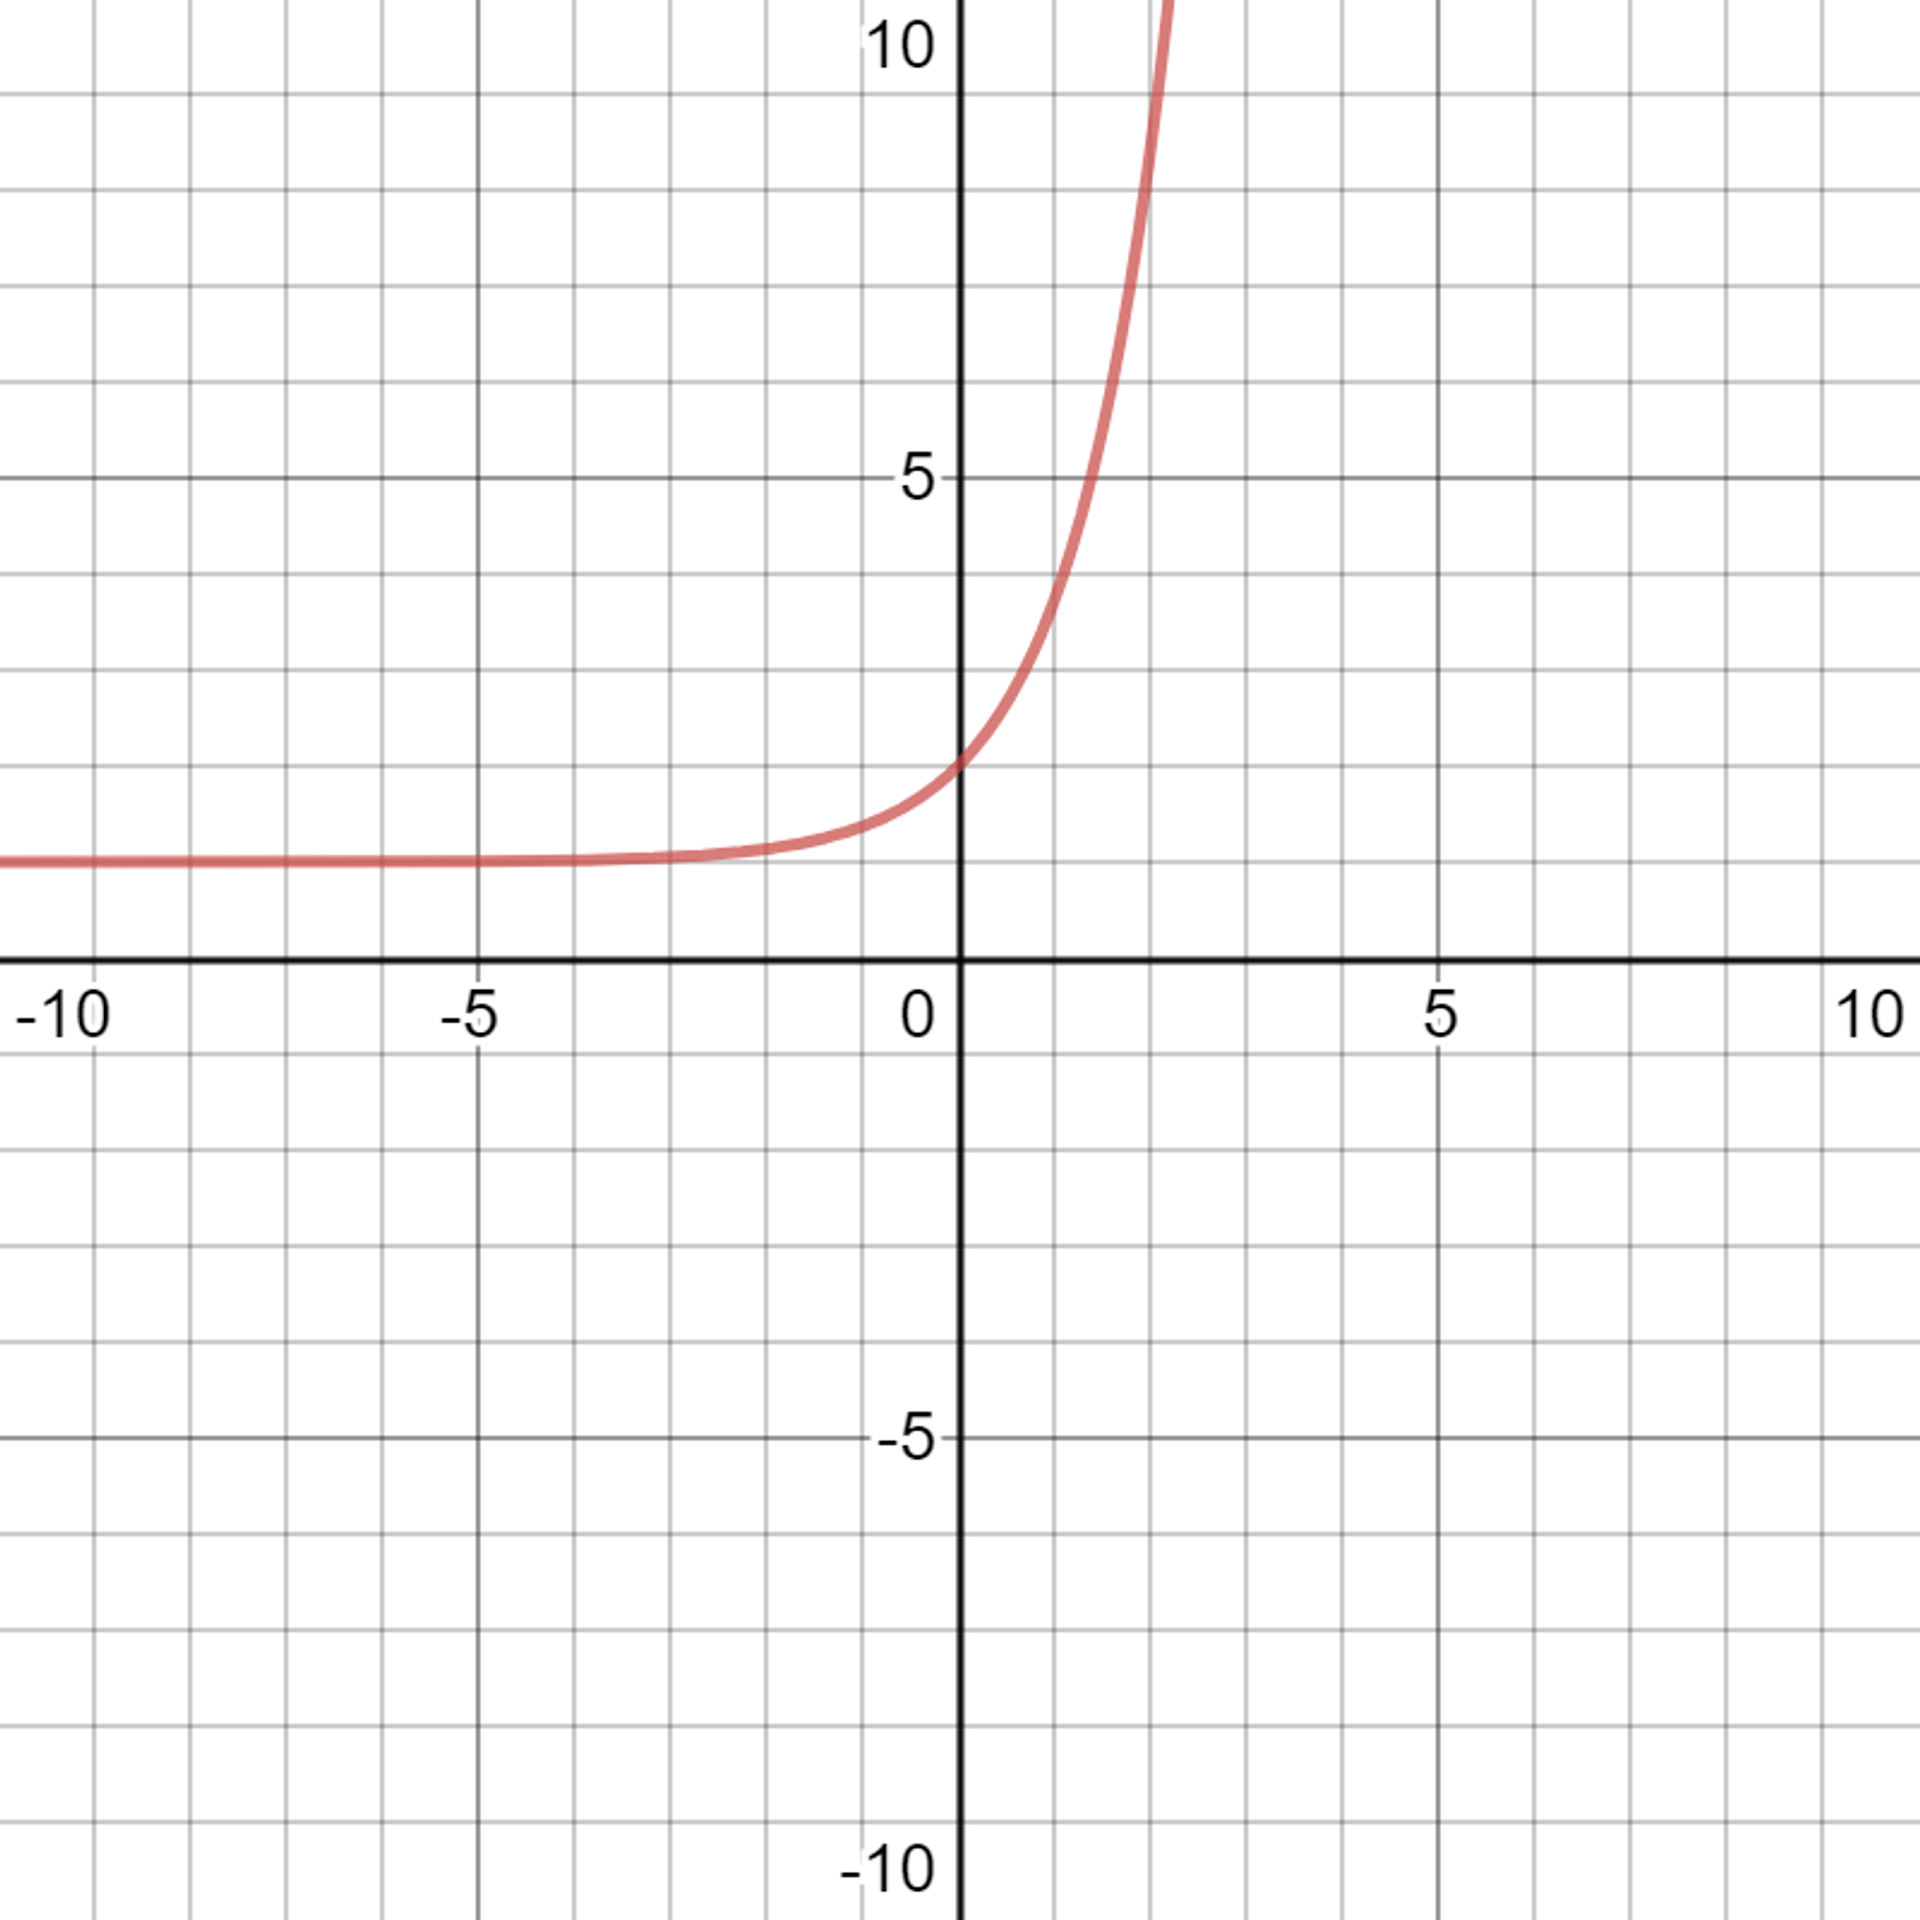
An exponential function follows this formula:
Where is a constant number, known as Euler's Constant. It is roughly 2.72 .
would shift the graph up and down, whereas would scale the graph vertically. A graph with a positive and would look something like:

For a negative , the graph would look like:
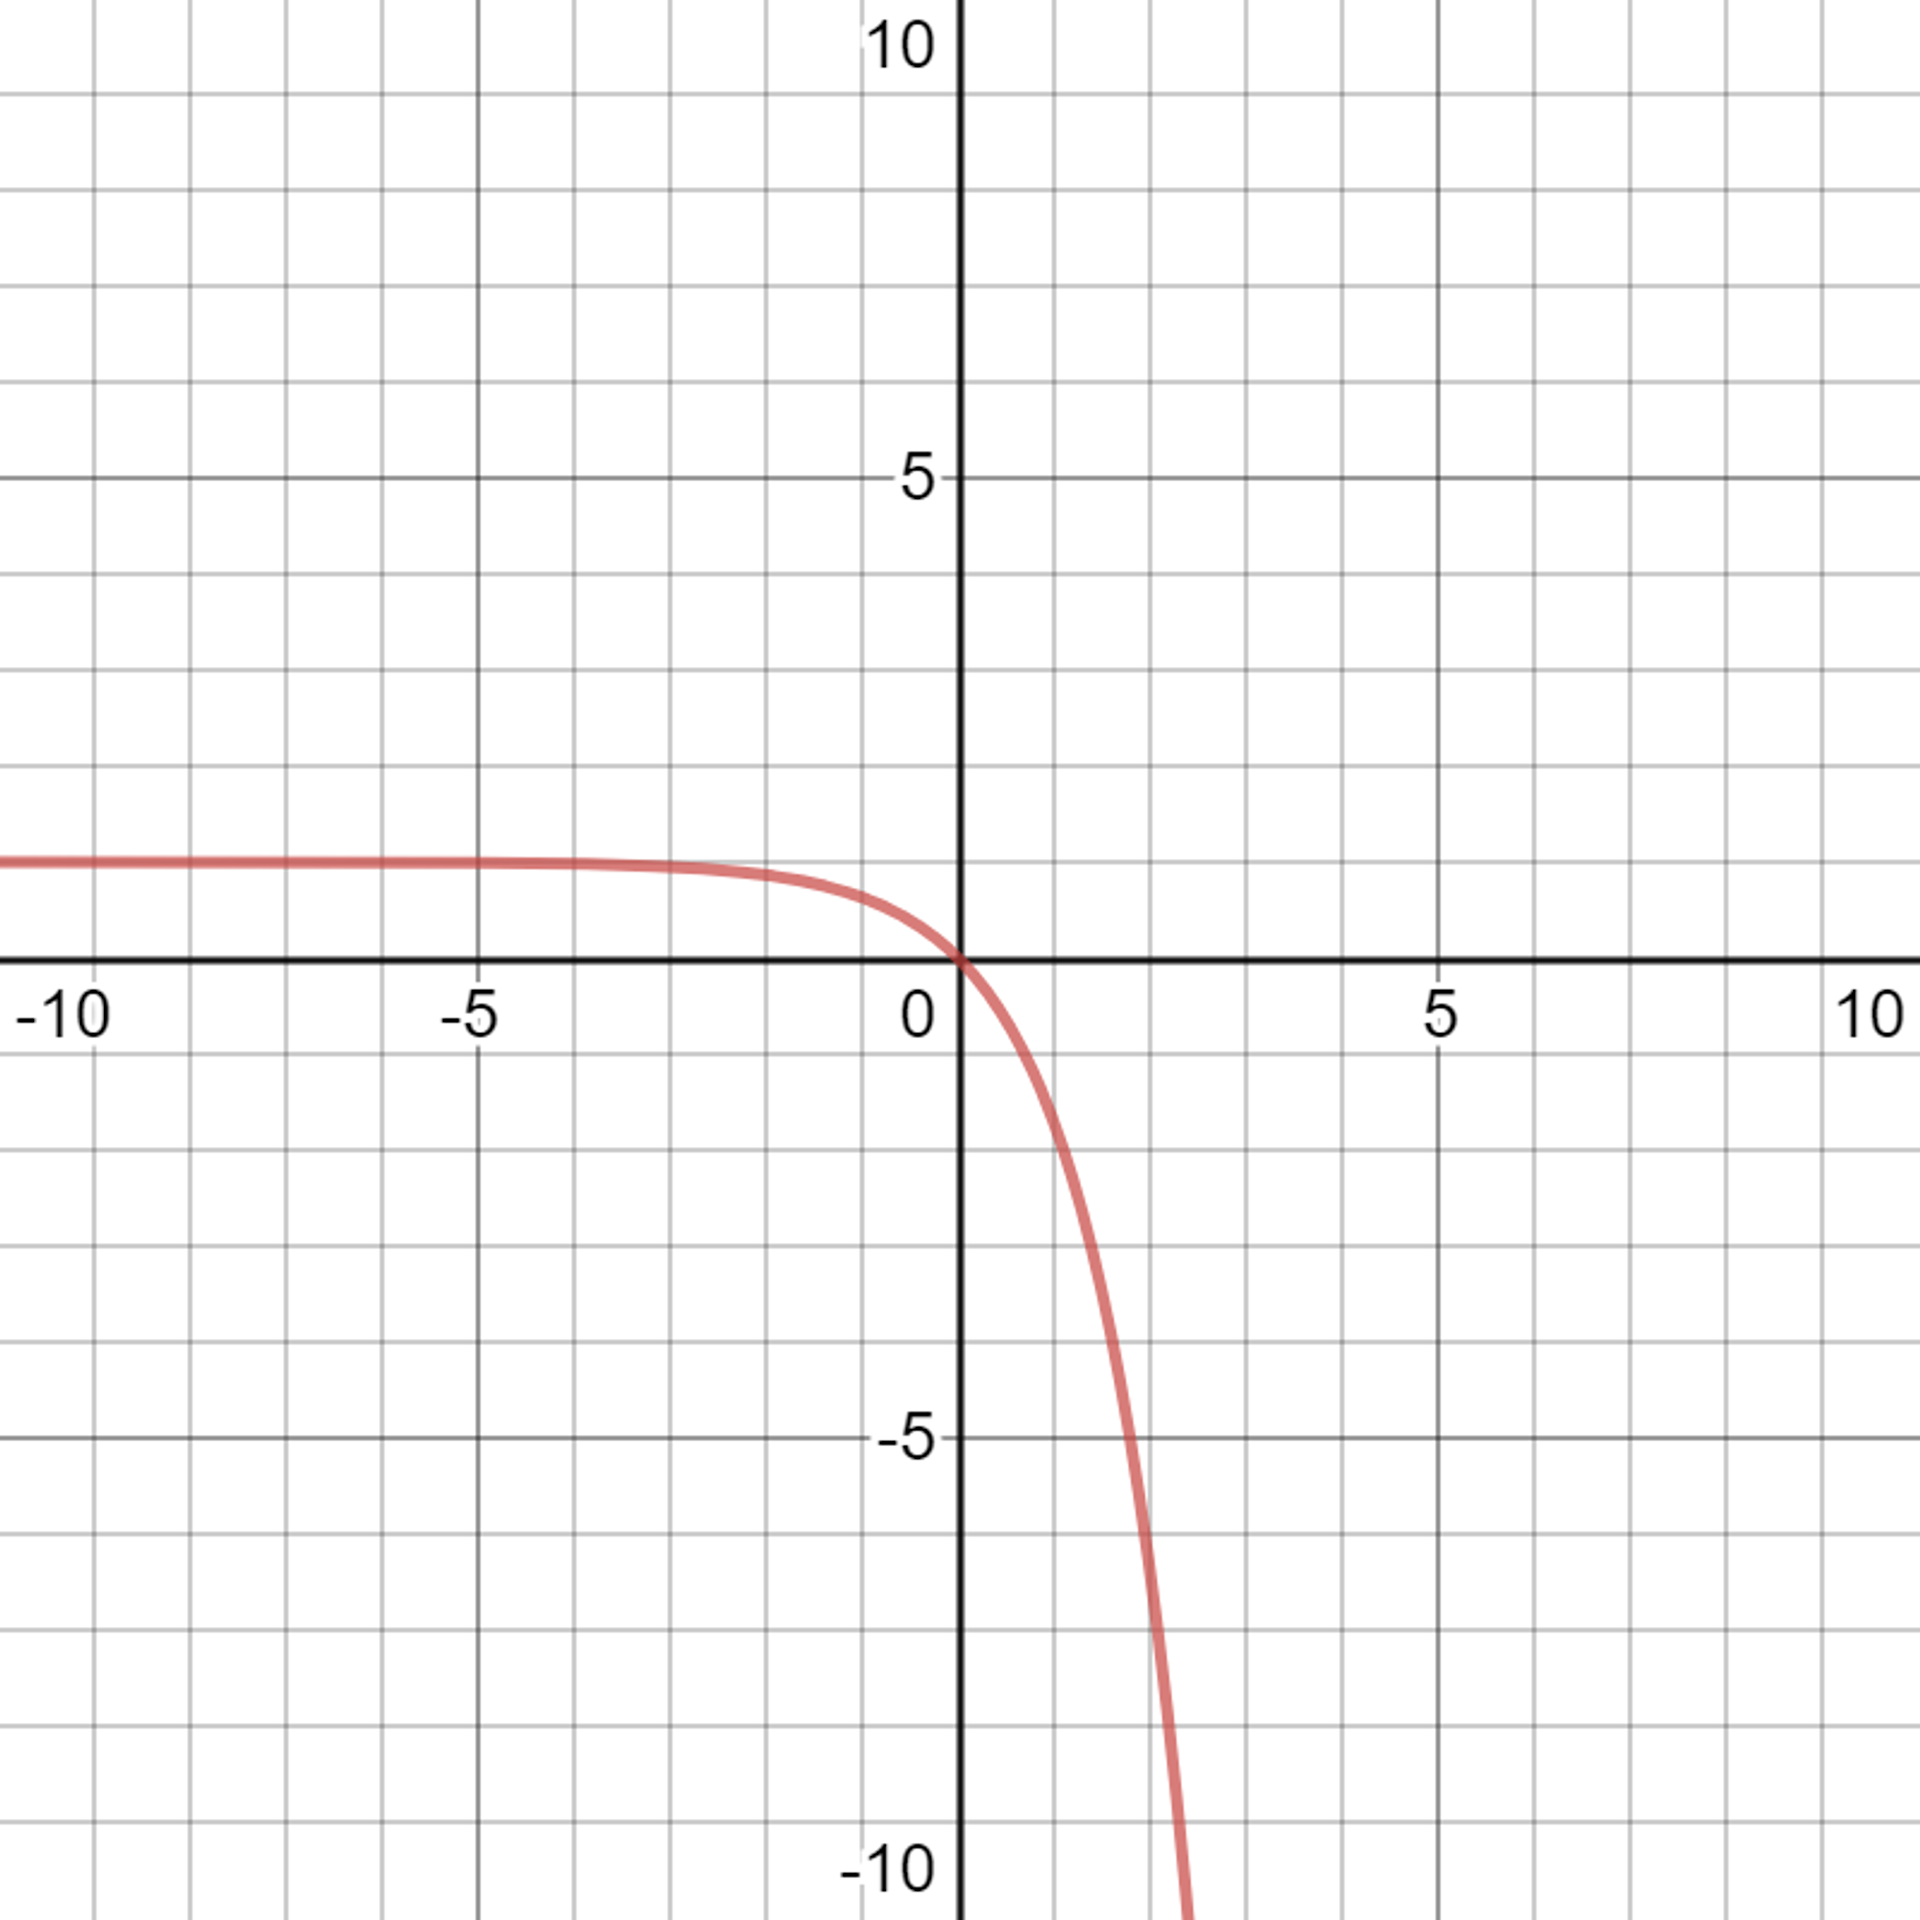
To produce just the term in Python, use
np.exp(x).We will implement this practically soon. Try to observe the general shape of these functions, it will help in deciding which kind of model to choose.
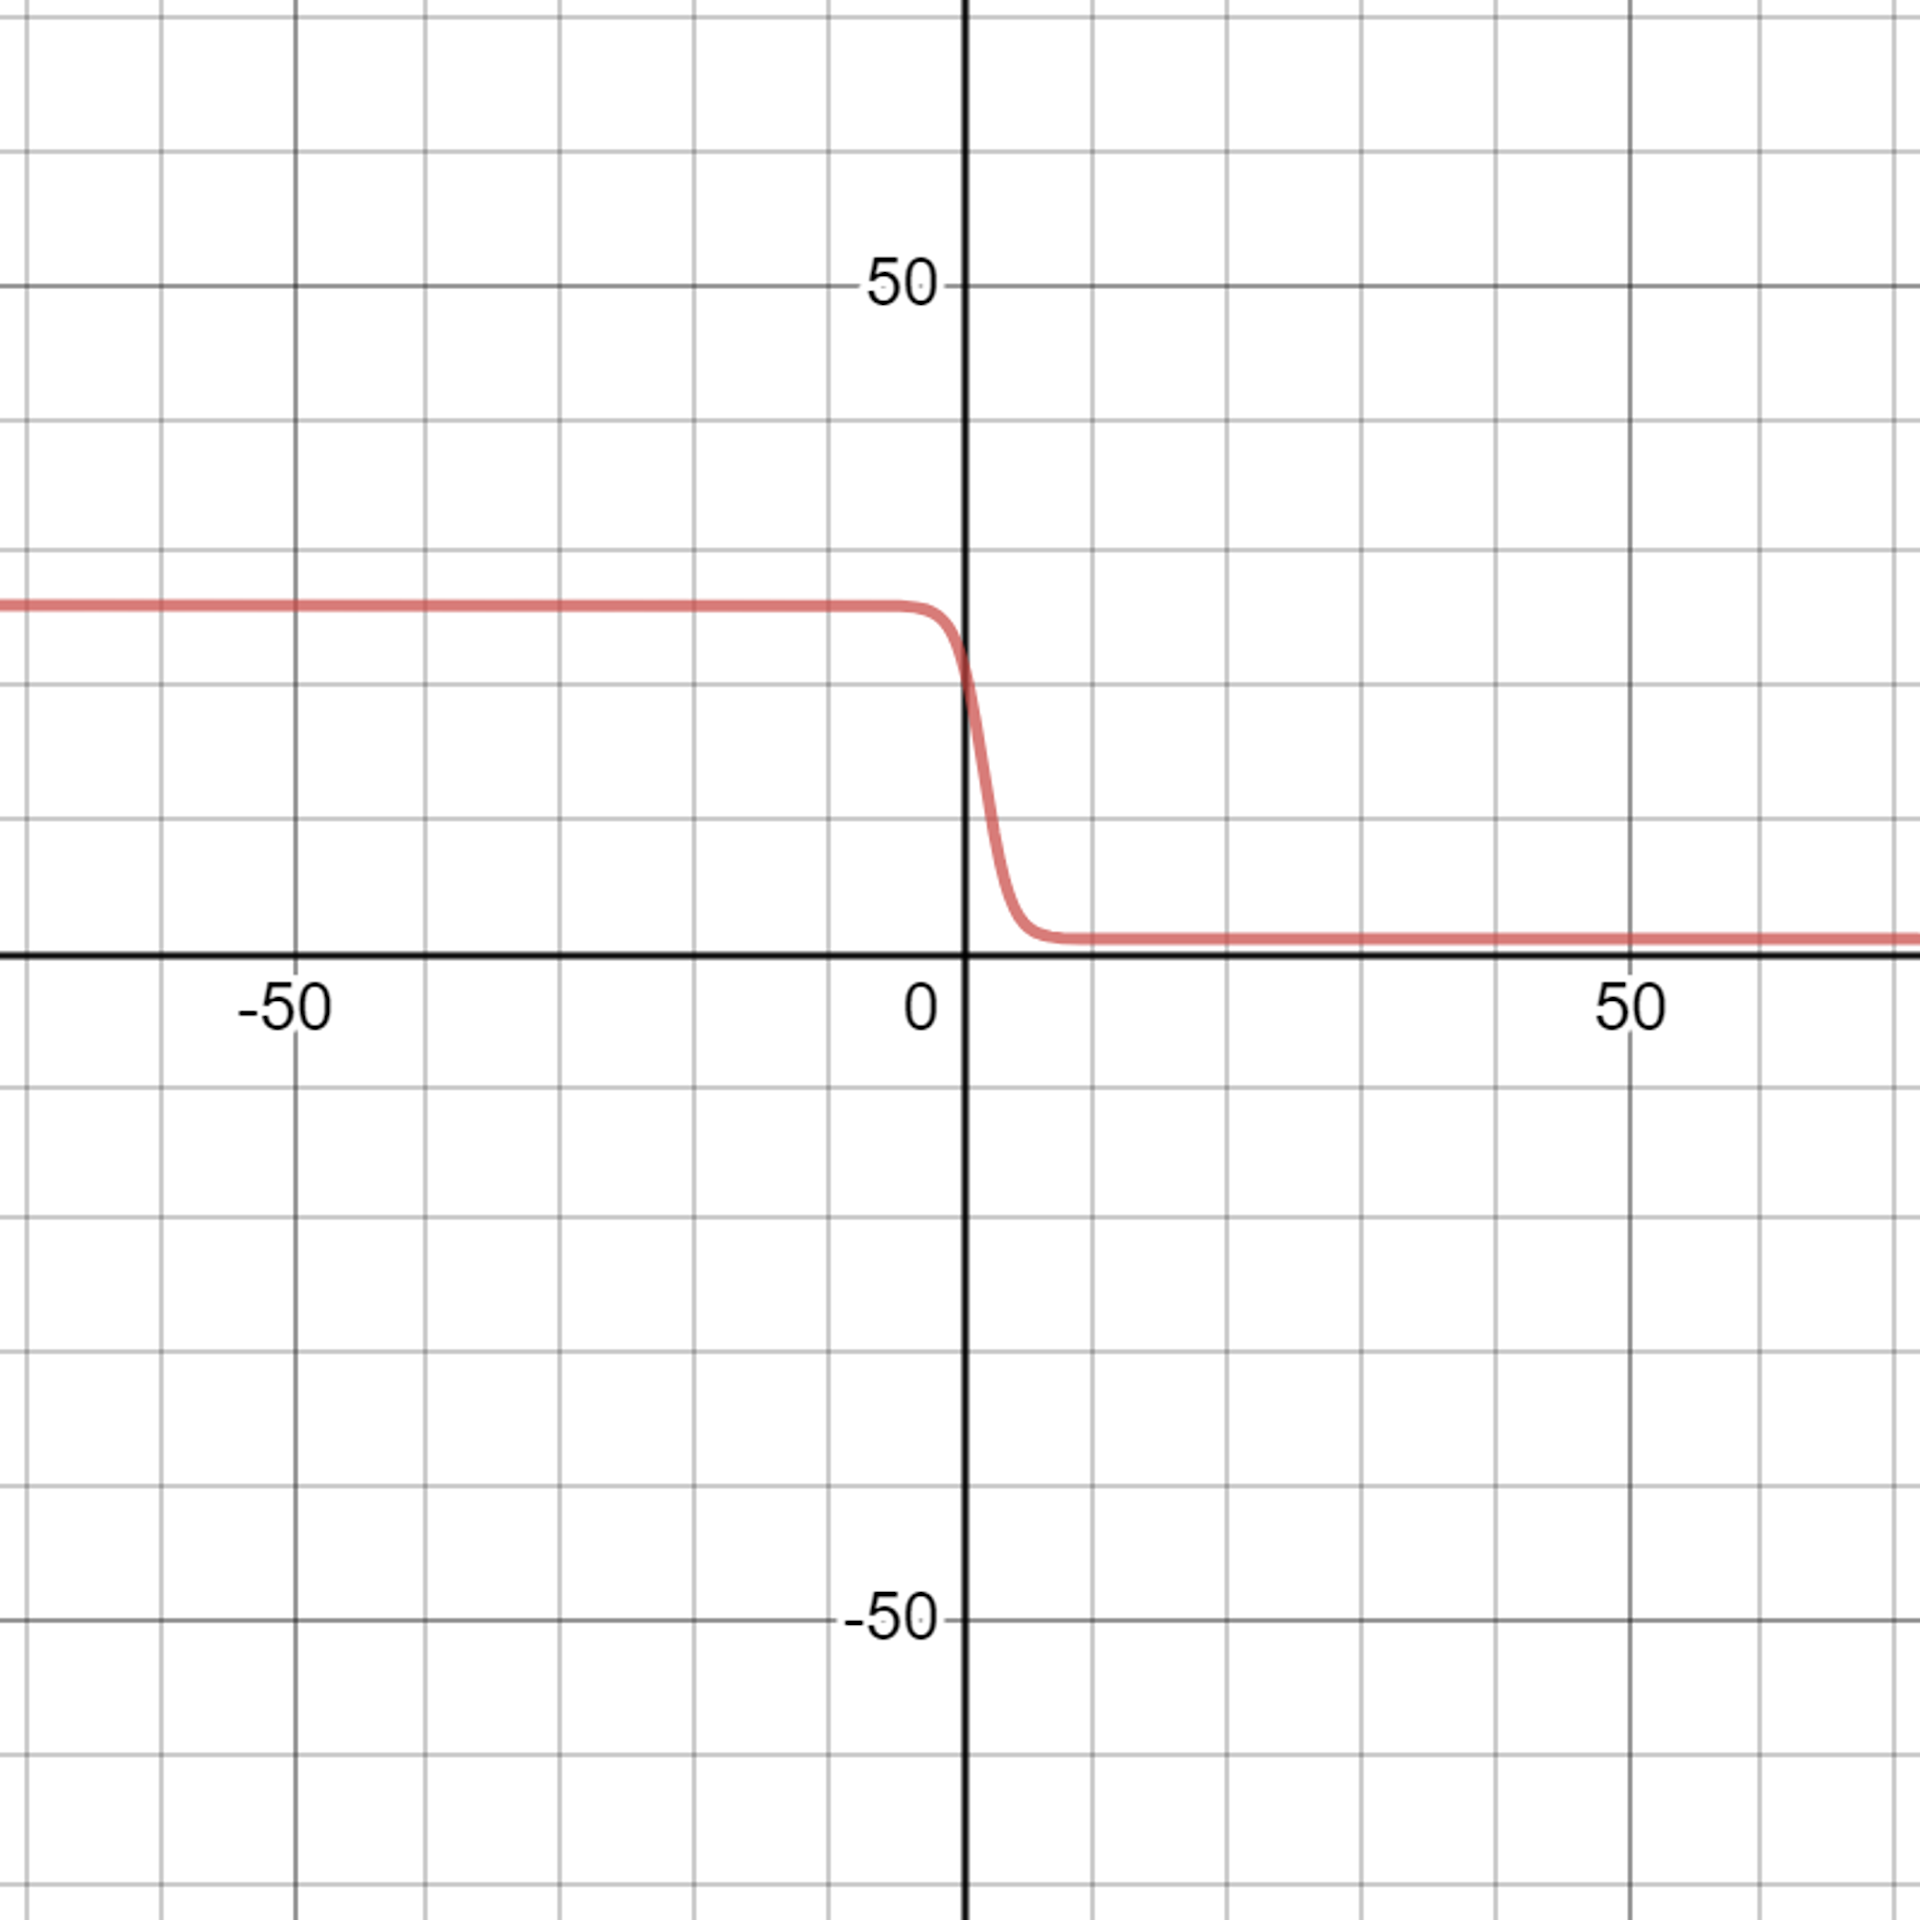
Sigmoidal/Logistic:
This is a bit more complicated model - but don't worry, programming will make it all a lot easier.
Copyright © 2021 Code 4 Tomorrow. All rights reserved.
The code in this course is licensed under the MIT License.
If you would like to use content from any of our courses, you must obtain our explicit written permission and provide credit. Please contact classes@code4tomorrow.org for inquiries.